Divorce Rate in America
Debunking the Myth that 50% of Marriages End in Divorce
Almost everyone has heard that 50% of marriages end in divorce. What most people don’t know is that this figure is merely a projection based on research that dates back to the 1970s, when there was a divorce boom after the introduction of no-fault divorce.
How many people are really getting divorced in the US?
One of the best ways to determine how many people are getting divorced is to look at the crude divorce rate, which is the number of divorces per one thousand people. This number is based on data collected by each state and voluntarily reported to the CDC/National Center for Health Statistics. The most recent data, www.cdc.gov, is from 2011, and does not include data from California, Georgia, Indiana, Louisiana, and Minnesota (states that do not report divorce data).
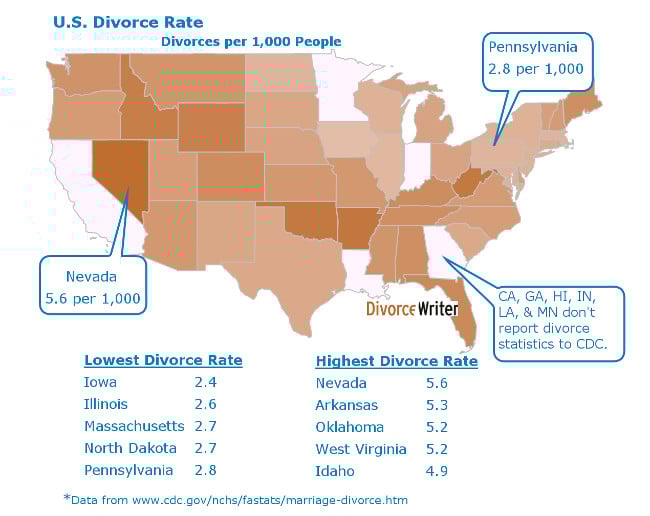
Nevada, Arkansas, Oklahoma, West Virginia, and Idaho have the top crude divorce rates. In contrast, Pennsylvania, Massachusetts, North Dakota, Illinois, and Iowa have the lowest crude divorce rates.
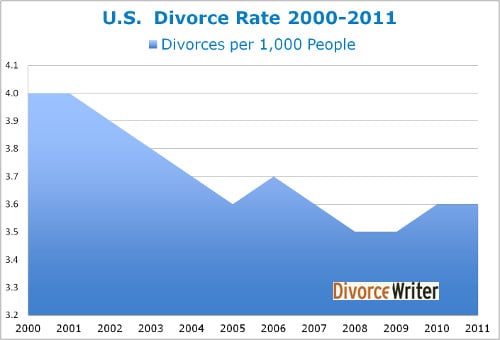
Looking at average trends in the US from 2000 to 2011, the average crude divorce rate has declined slightly.
What is the actual divorce rate, then?
The crude divorce rate is helpful in determining state-by-state and average US trends over time, but most people just want to know what actual percentage of marriages end in divorce each year. Typically, this number is computed by taking the number of marriages in a year and comparing it to the number of divorces in the same year, thus resulting in a "percentage of divorce" calculation. However, most people getting married one year are not the same people getting divorced in that same year. Comparing apples to oranges does not give an accurate picture of the overall, average divorce rate. The annual collection and publication of detailed marriage and divorce statistics for the US is incomplete, as state reporting is voluntary, and one of the largest states, California, does not participate in reporting. Therefore, the actual divorce rate based on statistical data is extremely hard to determine.
When research is based on surveys rather than statistical data, it appears that the percentage of marriages that end in divorce is around 31%. According to a 2009 Census Bureau SIPP survey (men and women, dealing with first marriage only), 72% of people who have ever been married are still married to their first spouse. One might conclude that the remaining 28% are not married because of divorce, but it is important to note that a certain percentage of these remaining non-married people could be that way due to the death of a spouse. The survey did not collect that information. Four other surveys collecting information on what percent of marriages end in divorce have similar results: 35.5% from the University of Chicago, General Social Survey, 2012; 33% from the Barna Group, 2008; and 37% from the Marist Poll for the Knights of Columbus, 2010.
Divorce Rate and Age
The rate of divorce has not occurred evenly across all age groups. A 2014 study conducted by researchers at the University of Minnesota found that in the 1970s, there wasn't much of a difference in the rate of divorce between young people and older people. Starting in 1980, however, the baby boomers started divorcing at a higher rate, and this trend continues through present day. According to the Bureau of Labor Statistics, eighty-seven percent of baby-boomers born in the years 1957-1964 had married at least once by the time they reached age 46. Of those who had married, 45% had experienced at least one divorce.
Conversely, the younger generation today has a much lower rate of divorce. This is most likely due to two reasons:
- Younger people are waiting longer to get married.
- Younger people are cohabitating instead of marrying.
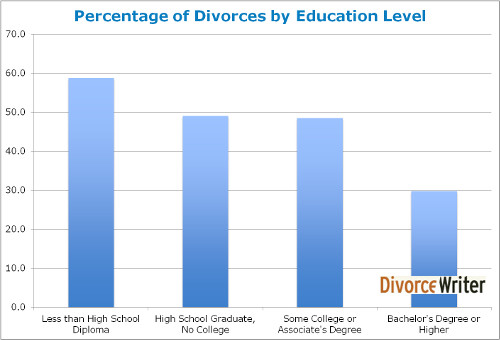
Divorce Rate and Education
Married couples by the age of 46, who have attained higher levels of education, are less likely to divorce than less-educated couples, according to a 2013 study by the Bureau of Labor Statistics.
Divorce Rate and the Economy
There is a lot of conflicting research when it comes to determining whether or not, or to what extent the state of the economy affects the divorce rate. What is consistent, however, is the notion that the divorce rate generally goes down during economic recessions, and rises again once economic recovery begins. What is hard to determine is whether the percentage of couples who decide to stay together during economic recession do so because economic hardship brought them closer, or if it is just because they just couldn’t afford a divorce. Many researchers agree that financial crises change the timing of divorce, they don’t prevent them.
Divorce Rate and Second Marriages
National statistical data on divorce from a second marriage is even sparser than that on first marriages. According to Mark Banschick, M.D., author of The Intelligent Divorce, 67% of second marriages and 73% of third marriages end in divorce. However, no basis for this calculation is given, and these two percentages seem to be quoted as much as the 50% first marriage divorce rate. Shaunti Feldhahn, a Harvard-trained social researcher and author of The Good News about Marriage, looks to the 2009 US Census Bureau SIPP Survey to derive the divorce rate for second marriages. According to the survey, 65% of women in their second marriages are still married to that spouse. Among the 35% remaining, there is a higher likelihood that the marriage ended in death rather than divorce, given the marriage most likely started at an older age. Without good, national data sets on divorce rates for subsequent marriages, it is hard to know what the actual number is.